 Slide 1. Title page and acknowledgements.
Patterns of ontogenetic shifts in nekton habitat use along a marsh coenocline: Atlantic silverside case study
Rodney Rountree and Francis Juanes, Dept. Natural Resources Conservation, UMASS-Amherst
A contributed paper presented at the Southern New England Chapter of the American Fisheries Society, Summer Meeting June 14, 2000, Old Lyme, Connecticut.
Abstract
A growing body of evidence suggest that communities of marsh nekton are stratified along a depth gradient partly in response to the influence of tidal and diel changes in physical conditions. In addition, ontogenetic shifts in habitat use along this gradient are key to our understanding of marsh function and the process of trophic relay, yet have rarely been specifically addressed. The goal of this study was to develop sampling methodologies and collect preliminary data to test the hypothesis that nekton faunal assemblages, species densities, and ontogenetic stages of Atlantic silversides and other species, are stratified along a marsh creek-to-bay coenocline (i.e., the marsh gradient). Preliminary results include: 1) successful development and use of a new seine sampling technique that provides density estimates of nekton in marsh creek and shallow bay environments, 2) we obtained sufficient preliminary data (69 seine samples) to compare the effectiveness of this new technique against a more conventional standardized seining method, 3) we obtained preliminary data on the diel and tidal changes in temperature along the marsh gradient, 4) we obtained preliminary data illustrating strong diel changes in nekton density distributions and faunal assemblages along the marsh gradient, and , and 5) we obtained preliminary data suggesting strong ontogenetic shifts in density distributions along the marsh gradient, and of strong interactions with diel period suggesting ontogenetic diel migration patterns. Amazingly, low tide fish densities reached values well over 500 fish sq. m.
[Click on thumbnails to view full size figures]
Slide 1. Title page and acknowledgements.
 Slide 2. Marsh gradient - Introduce concept of a marsh gradient following a tidal elevation gradient. Environmental gradients result from interactions among atmospheric, terrestrial, and aquatic influences mediated by the depth gradient. Tidal and diel cycles interact in complex ways with these gradients resulting in gradient reversals, etc. Faunal assemblages associated with any habitat located along the gradient will be strongly influenced by their physiological response to the marsh gradient. Diel, tidal and ontogenetic movements are likely to be directly influenced by tidal and diel cycles in the marsh gradient.
 Slide 3. A random stratified sampling design was used. A subtidal marsh creek was divided into three strata, Upper creek > 246 m above the creek mouth (located at the main fork in the creek channel), Lower creek (0-246 m), and Bay (0 to -125 m from the creek mouth).
 Slide 4. Paired 5-m wide sections of the creek were to be simultaneously blocked off at low tide at random locations within each creek strata (this technique could not be used in the bay strata). Three "clotheslines" were set out at 5-m intervals along the creek at high tide prior to sampling. A block net was attached to each clothesline and stacked up on one creek side. At low tide the nets would be set by simultaneously pulling the nets with "pull" lines from the opposite back in a manner similar to pulling a shower curtain. Once the block nets were in place at low tide, a 5-m seine was used to make repeated seines inside each of the paired sections. Similar sampling was conducted just outside of the block nets for comparison (see next slides).
 Slide 5. Top block net attached to a clothesline and ready for deployment. Bottom - setting the block nets at low tide by pulling them from the opposite bank. Technicians approached the area keeping well away from the bank to avoid disturbance. Once in position, they waited 2 minutes for any disturbance to die down before simultaneously pulling the block nets across. In generally took about 15 seconds to set the nets in this manner.
 Slide 6. Top- three block-nets in place at low tide forming two adjacent 5-m sample sections. Each block net was lined with 1/4" gauge galvanized chain. Bottom - three repeated seines with a 5-m tunnel seine with attached live car were made within each 5-m creek section.
 Slide 7. From 1 to 3 repeated seines were also made 5 meters above the block nets to allow a comparison of standardized seine methods with the block net methods. A 5-m restriction line was used on the seine to insure a 5-m wide sweep area.
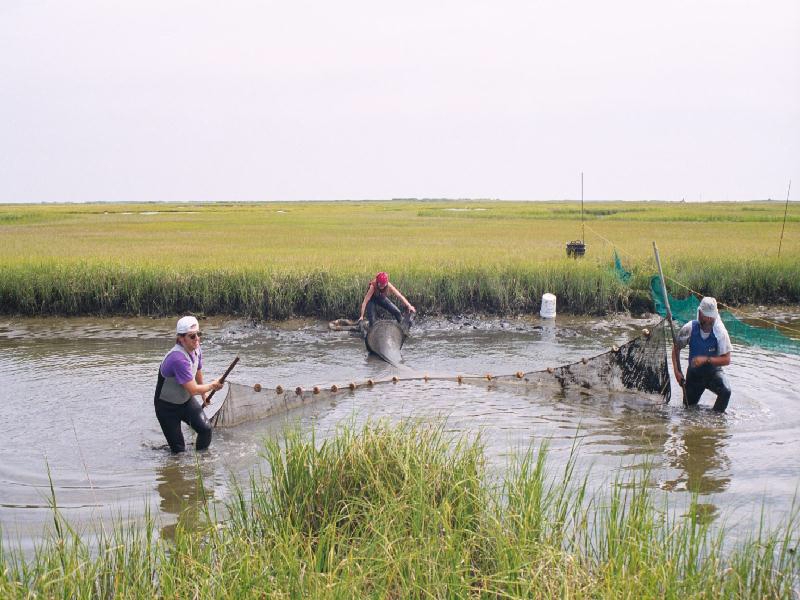
 Slide 8. A somewhat different approach was necessary in the bay strata. Six temporary poles were set in the bay at high tide to form a 5-m by 15-m rectangular sampling area. Two random locations were chosen to obtain replication. At low tide a single large block net was walked around the perimeter of the stakes to enclose the 75-m2 area. Top - Simultaneously setting two enclosures, Center - conducting standardized seines outside of the enclosures for comparison, Bottom - conducting 3 repeated seines within each enclosure.
Slide 9. See Figure 7 in the interim report. Changes in water temperature over three days at different locations along the gradient. Note strong diel and tidal interactions in temperature cycles. Strong damping of the cycles moving down the gradient. Water temperatures exhibited diel cycles of 10 C in the upper creek, but only a couple degrees in the bay.
 Slide 10. Basic catch statistics including top species by density and biomass. Note, maximum densities exceeded 800 animals per square meter!
 Slide 11. A comparison of densities between experimental (block nets) and control seines. Most species, with the notable exception of Cyprinodon variegatus, were more abundant in the experimental nets.
 Slide 12. Comparison of the size structure of Atlantic silversides, Menidia menidia, and mummichog, Fudulus heteroclitus, between experimental and control seines. Note that experimental seines not only captured much higher abundances of Atlantic silverside, but that larger size classes were strongly under represented in the control seines. Mummichogs were captured in greater abundance in the experimental seines, but no size related differences in catches between the seine types were noted.
 Slide 13. Comparison of size structure for the shrimps Palaemonetes pugio and P. vulgaris between experimental and control seines. Although mean densities for P. pugio were only slightly higher in experimental seines (Fig. 11), note the bias in capture of larger individuals. In contrast, strong differences in the catch of P. vulgaris between experimental and control seines do not result from size related differences.
 Slide 14. Comparison of catches between day and night samples. Total catch were twice as high, and Atlantic silversides were 10 times as high at night, while catches of many species traditionally considered marsh residents were typically greater during the day.
 Slide 15. Most species exhibited strong density differences among strata. Total densities were 20 times greater in the upper creek than in the bay.
 Slide 16. Despite strongly increasing densities moving up the creek gradient, diversity was greatest in the bay and lowest in the upper creek strata.
 Slide 17. Canonical discrimination analysis of strata group means showing 95% C.I. of strata canonical means (ellipses). Igenvectors of species with original variates (densities) strongly correlated with canonical axis are shown (Species shown in red are significantly correlated with CAN2, blue with Can1, and green with both axes).
 Slide 18. Comparison of diel and strata interactions on Atlantic silverside density (top) and mean size (bottom). Note, inverse size gradients between day and night, and near zero densities in the bay and lower creek during the day.
 Slide 19. Changes in Atlantic silverside size structure between strata and diel periods. Data from bay day and night samples and lower creek day samples were excluded due to their low densities. Note the strong shift in dominant size classes between day and night resulting from the migration of larger silversides into the lower and upper creeks at night (presumable from the open bay) as previously reported by Rountree and Able 1993. Interestingly, the smallest size cohort is restricted to the upper creek during the day (virtually absent from the lower creek), but is present in both upper creek and lower creek strata at night. This pattern might be explained as a down-gradient migration of the smaller size class at night (opposite to that of the larger size class), or by the influx of small individuals from the bay at night.
 Slide 20. The next three slides will be in the same format. The main graph shows changes in the size density structure among diel periods and strata. The top inset shows total density differences, and the bottom inset shows mean size differences. Note that mummichog densities increased strongly moving up the gradient, but were consistently greater during the day (top inset). In contrast, mean size declined moving up the gradient (the low bay size mean during the day is based on a single individual) but were only slightly larger during the day than at night (bottom inset). The size class structure appears to be similar during both day and night samples.
 Slide 21. Densities of Palaemonetes pugio increased strongly moving up the gradient and were greatest during the day (top inset), however mean size tended to decline up gradient and was higher at night than during the day (bottom inset). The size reason for this is suggest by strong differences in the size class density structure among strata and diel periods. During the day the upper creek is dominated by large densities of a 7-mm size class (yellow) which disappears at night (brown). In contrast an 11-mm size class dominates the lower creek during the day but then declines strongly at night. At the same time the 11-mm size class dominates the upper creek night samples. So, during the day we have strong size stratification between upper and lower creek strata, which disappears at night (resulting in the similar day and night size means in the lower strata and diverging means in the upper strata, bottom inset). This pattern is best explained by the migration of the small size class out of the sampling area at night (probably farther up gradient) and up gradient shift of the larger size class group from the lower to upper creek strata.
 Slide 22. Gobies exhibited a complex size class density structure and patterns. They were most dense in the lower creek and during the day, but as with P. pugio mean sizes diverged in the upper creek (though here large gobies present during the day compared with night while the opposite pattern was observed for P. pugio). These patterns suggest size related diel migration pattern, with larger gobies tending to migrate between upper and lower creek strata, perhaps to avoid lower up creek dissolved oxygen concentrations at night.
 Slide 23. Conclusions.
Return to :| TOP |
This page was last modified on July 20, 2001
Copyright (c) 1999 by Rodney Rountree. All rights reserved
Navigate to main estuarine pages: [ | merp | weirmeth ]
Navigate to main pages: [ Diets | Photos | Estuarine | FADs | Soniferous | CV | Home Page ]